To Know Box Plot
Box Plot (箱线图)
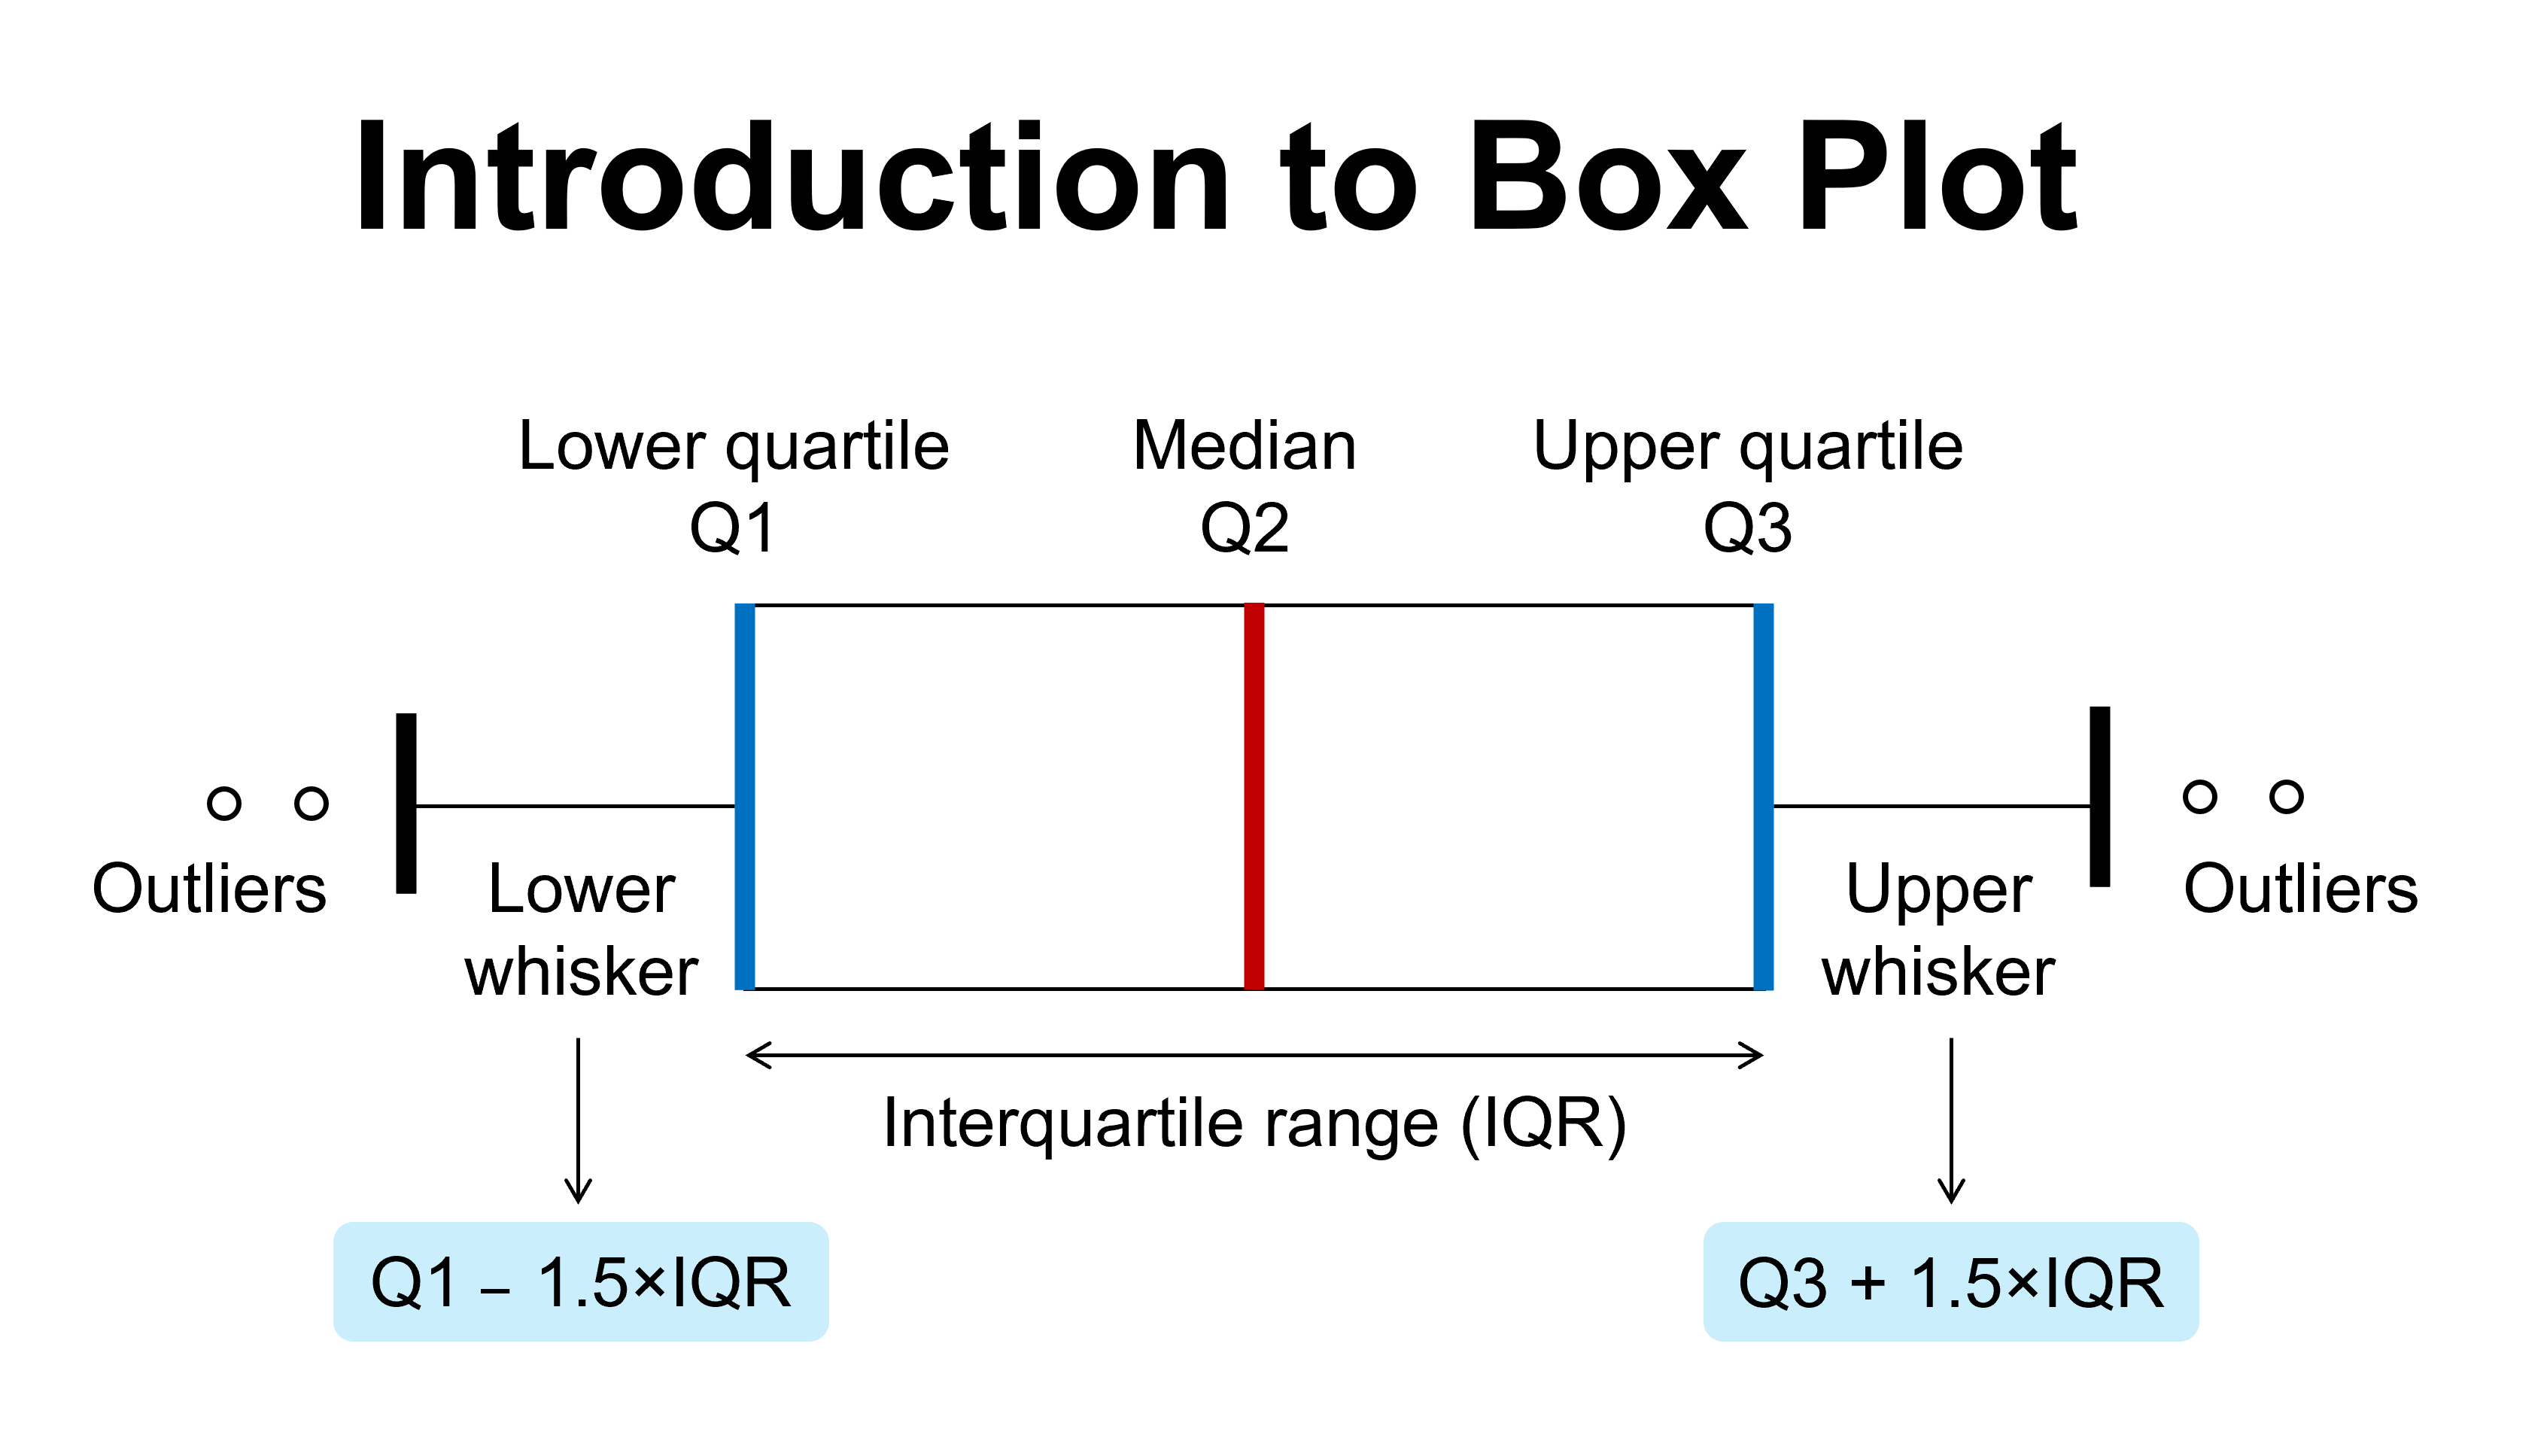
Full name: box-and-whisker plot
Box plot is a statistical chart used to display the dispersion of a set of data. This plot shows the typical values below:
- Q1: lower interquartile
- Q2: median
- Q3: upper interquartile
- min and max values except for outliers
- outliers
Box:
- two ends of the box: Q1 and Q3.
- line in box: Q2 (median).
Whiskers:
- show the min.and max values of a set of data, except for outliers.
- lower whisker: Q1 - 1.5×IQR
- upper whisker: Q3 + 1.5×IQR
- IQR = interquartile range = Q3 - Q1.
Outliers:
- data points located outside the whisker range (min-max).